Monday, 9 April 2012

Case Study - TSH


1. Trendline: uptrend (bullish)
2. Bollinger band : squeezed, pending breakout (neutral)
3. Volume: above 40ma (bullish)
4. ADX: uptrend with strong momentum (bullish)
5. MACD: uptrend, pending bullish crossover, rounding bottom (bullish)
6. RSI: break 50%, pending 70% breakout (bullish)
7. Sto: bullish crossover, penidng 80% breakout (bullish)
8. volume distributiion : big fish is selling, be careful (bearish)


conclusion: 7 bull 1 neutral

position: long

entry price: 2.42
profit taking: 2.55,2.63
cut loss: 2.22

Case Study - TASCO


1. Trendline: uptrend (bullish)
2. candle stick: white long body (bullish)
3. volume : below 40ma (bearish)
4. ADX: uptrend with strong momentum (bullish)
5. MACD: uptrend, bottom rounding, pending bullish crossover (bullish)
6. RSI: rebounce from 50%, pending 70% crossover (bullish)
7. Sto: bullish kissover, pending 80% crossover (bullish)
8. volume distribution: high buying pressure (bullish)


conclusion: 7 bull 1 bear

position: long

entry price: 2.19
profit taking: 2.29, 2.38
cut loss: 2.02

Case Study - TAKAFUL


1. Trendline: uptrend (bullish)
2. candle stick: shoting star (bearish)
3. volume : below 40ma (bearish)
4. ADX: uptrend with strong momentum (bullish)
5. MACD: uptrend (bullish)
6. RSI: above 70% (bullish)
7. Sto: above: 80% (bullish)
8. volume distribution: high buying pressure (bullish)

Agressive buyer
entry price: 3.87
profit taking: 4.05, 4.23, 4.41
cut loss: 3.62

entry price: 3.49 or 10ma (when retrace)
profit taking: 3.62, 3.83,4.05
cut loss: 3.14

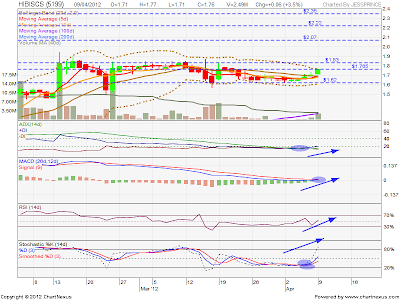
Case Study: HIBISCS


1. trendline: sideway (neutral)
2. candle stick: long white body (bullish)
3. volume : declining,less than 40ma (bearish)
4. Bollinger band: squeezing, pending breakout (neutral)
5. ADX: uptrend with weak momentum (bullish)
6. MACD: BUllish kissover, rounding bottom (bullish)
7. RSI: rebounce and break 50%, (bullish)
8. Sto: break 50% (bullish)
9. volume distribution: high buying pressure (bullish)


conclusion: 6 bull 1 bear 2 neutral

entry price: 1.85
profit taking: 2.05, 2.20, 2.33
cut loss: 1.74

Case Study - Harta


1. Trendline: consolidation (neutral)
2. volume : above 40ma (bullish)
3. Bollinger band : squeezing, pending breakout (neutral)
4. ADX: bullish crossover (bullish)
5. MACD: downtrend, pending bullish crossover (bearish)
6. RSI: heading 30%, pending rebounce (bearish)
7. Sto: bullish crossover and rebounce from 20% (bullish)
8. volume distribution: high buying pressure (bullish)


conclusion: 4 bull 2 bear 2 neutral

position: long

entry price: 8.13
profit taking: 8.43, 9.20, 9.68
cut loss: 7.76

Case Study - JOHOTIN


1. Trendline: consolidation (neutral)
2. Candle Stick: white long body (bullish)
3. Bollinger band: squeezing, pending breakout (neutral)
4. MACD: forming rounding bottom, pending positive histogam (bullish)
5. ADX: uptrend with high momentum (bullish)
6. RSI: breakout 50% (bullish)
7. Sto: bullish crossover (breakout 80%- bullish)
8. volume distribution: high buying pressure (bullish)


conclusion: 6 bull 2 neutral

position : long

entry price: 1.32
profit taking: 1.41, 1.49
cut loss: 1.16

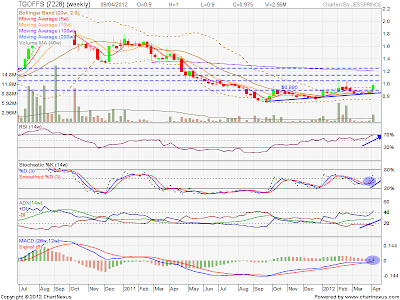
Case Study - TGOFFS


Note: Weekly chart

1. Trendline: Breakout of ascending triangle (bullish)
2. candle stick: white long body (bullish)
3. volume : above 40w ma
4.ADX: uptrend with strong momentum (bullish)
5. MACD: 4R1G (Bullish)
6.RSI: Above 70% (bullish)
7. Sto: bullish crossover (bullish)
8. volume distribution: high buying pressure (bullish)


conclusion: 8 bull 0 bear

position: long

entry: 1.05
profit taking: 1.12, 1.23
cut loss: 1.02

High risk taker:
entry : 0.92
profit taking: 1.02, 1.12, 1.23
cut loss: 0.87