Friday 26 August 2011

U.S. Stocks Rally as Bernanke Signals Economy Doesn’t Need Immediate Aid

U.S. stocks surged, erasing a 221- point decline in the Dow Jones Industrial Average, as Federal Reserve Chairman Ben S. Bernanke indicated the economy isn’t deteriorating fast enough to warrant any immediate stimulus amid valuations close to the lowest in 2 1/2 years.
Home Depot Inc., Caterpillar Inc. and Alcoa Inc. (AA) led gains among the biggest companies most-tied to the economy, rising at least 1.2 percent. Technology shares rose the most among groups in the S&P 500, with Cisco Systems Inc. and Intel Corp. advancing more than 1.9 percent. Tiffany & Co. (TIF), the world’s second-largest luxury jewelry retailer, added 7.1 percent after reporting profit that beat analysts’ estimates and raising its earnings forecast.
The Standard & Poor’s 500 Index rallied 1.2 percent to 1,173.35 at 12:02 p.m. in New York after initially plunging 2 percent following Bernanke’s remarks. The Dow Jones Industrial Average climbed 1.2 percent, or 133.09 points, to 11,282.91.
“This is exactly what the market wanted,” Keith Springer, who oversees $120 million as the president of Springer Financial Advisors in Sacramento, California, said in a telephone interview. “This is good news for investors because it’s telling you there’s no reason to panic because they have the impression is that the economy is getting better. If he threw more money at the economy it would have given the impression that things were out of control and the Fed was panicking.”
Stocks gyrated following the Bernanke speech, in which he said the central bank still has tools to stimulate the economy without signaling he will use them. He echoed comments of dissenting members of the Federal Open Market Committee who said U.S. economic data aren’t pointing to a recession.

Low Valuations

This year’s decline in the S&P 500 left the benchmark gauge for U.S. equities at 12.7 times reported earnings yesterday, more than 20 percent below its five-decade average. Barton Biggs, founder of hedge fund Traxis Partners LP, said last week that valuations are so low they could withstand a 15 percent decline in profits.
Earnings for companies in the index may rise 18 percent this year, according to the average estimate of analysts surveyed by Bloomberg. Economists predict gross domestic product will expand 1.75 percent this year and 2.35 percent in 2012, according to a survey of 56 respondents conducted by Bloomberg.
“Although important problems certainly exist, the growth fundamentals of the United States do not appear to have been permanently altered by the shocks of the past four years,” Bernanke said in prepared comments. “It may take some time, but we can reasonably expect to see a return to growth rates and employment levels consistent with those underlying fundamentals.”

Restricting Options

Rising consumer prices and signs the economy is still growing may be restricting Bernanke’s options. Gasoline costs are 33 percent higher, consumer inflation is twice as fast and inflation expectations are above levels since Bernanke signaled more easing a year ago. While the U.S. expansion has slowed, the Chicago Fed’s index of 85 economic indicators improved in July for a third month on gains in production.
The threat of deflation has subsided, with the Labor Department’s consumer price index, minus food and energy, rising 1.8 percent for the 12 months ending July. It increased at a 0.9 percent 12-month rate in July 2010 before Bernanke’s Jackson Hole speech last year.
A measure of inflation expectations watched by the Fed is showing that traders see annual price increases of 2.77 percent starting in five years, compared with 2.22 percent a year ago.

‘Risking Its Credibility’

Fed bank presidents Charles Plosser of Philadelphia, Richard Fisher of Dallas and Narayana Kocherlakota of Minneapolis voted against the Fed’s decision to keep the target for the federal funds rate at zero to 0.25 percent until at least mid-2013. Plosser and Fisher said last week the pledge won’t help spur growth. The last time three policy makers dissented was in November 1992.
“Our problems are not problems easily addressed by monetary policy,” Plosser said in an Aug. 17 interview, adding that the Fed is “risking its credibility because it’s doing things that don’t work.”
Last year, Bernanke hinted that the Fed might embark on a second round of asset purchases to bolster the recovery, kicking off a 30 percent rally in the S&P 500 that ended in a three-year high on April 29.
Policy makers this month pledged to keep their benchmark interest rate near zero until at least mid-2013 and said they “discussed the range of policy tools” available, signaling they may add to their record stimulus.

Stimulus Options

Bernanke told Congress on July 13 the Fed has stimulus options. They may include buying additional securities, increasing the average maturity of its bond portfolio, lowering the interest rate on excess reserves and pledging to keep its balance sheet near a record high for a longer period of time.
Morgan Stanley analysts have cut their estimate for expansion worldwide this year to 3.9 percent from a previous prediction of 4.2 percent. Part of the reason was “the drama” around lifting the U.S. debt ceiling, which helped depress financial markets and erode business and consumer confidence, the analysts said in a report last week.
President Barack Obama signed a plan to raise the federal debt limit on Aug. 2, the deadline to avoid a possible default, after months of wrangling with Congress. The deal would make $2.4 trillion in deficit cuts over 10 years.

Tuesday 23 August 2011

The Leverage Cliff: Watch Your Step

Good article from : The Leverage Cliff: Watch Your Step

Due to positive experiences, many people grow comfortable with hedge fund managers and the leverage they use, even without fully understanding the dangers leverage can pose when times get tough. Understanding horizon leverage and risk tolerance can help the investor avoid financial ruin when the perfect storm hits.
Horizon Leverage and the Positive Return Dilemma
Many smart people managing sophisticated funds have run clients into financial ruin. Why? Because money managers are not properly accounting for horizon leverage. Investors who don't have money to lose must not over-wager with these managers, hoping the perfect storm won't hit; it's better is to plan that it will, and adjust your risk parameters accordingly. (For more tips, check out 8 Ways To Survive A Market Downturn.)
Let's Play a GameFor instance, imagine you were to place a bet where the odds of you winning are great, but the consequence of losing is bankruptcy. To a person who understands positive expected return - defined loosely as the product of the probability of a positive outcome times the expected reward is greater than the product of the probability of a negative outcome times the expected loss - this seems like a good bet.
Now suppose you start with a bet of $10 and win! This game seems good, so you play again and again until you are now going double or nothing on several million dollars. While the odds of winning haven't changed, the disastrous consequences of losing have. Beware! You are going up a leverage cliff, and you are about fall off. After about twenty years into the game, the perfect storm hits and you are broke and despondent.
Financial Ruin Using Sound StrategiesA money manager who is myopically focused on positive expected return plays the game over and over again, leveraging up bets. The leverage investment strategy may be sound, but risk tolerance of constituent investors is not being factored in. It is a mathematically certainty that eventually you will lose the bet, and you'd better hope you are not betting all of your money when it happens.
This is a problem for many investors, since money managers often don't feel your risk tolerance like you do. Money managers only focus on expected return and get lost in it, not accounting for the horizon leverage. They are being well compensated for generating high returns, but do not suffer as much if the perfect storm hits, which eventually it will, since all of their money is likely not in the fund. (For more, read Use A Money Manager Or Go It Alone?)
Bankruptcy or No BankruptcyIf money managers did feel your risk tolerance, things would be much different. This can be readily witnessed on the game show Deal or No Deal, where the player guesses on which briefcase holds a million dollars, and is then made offers to stop playing before going through all the cases. The offer is rarely a good move based on an expected return standpoint, suggesting that you should keep climbing up the cliff and never take the "deal." However, some people do. Do they crunch numbers as they progress? No. Rather they go off their gut instincts.
Breaking this down a little further, they are starting to envision themselves with the money offered, understanding that they have a very real possibility of losing it. They then think about things like the time it would take them to earn the wagered amount, the time it would take them to replace the wagered amount if lost, and savings goals relative to their ages.
One step further, I would almost guarantee you that if Warren Buffet played the game, he would never make a deal due to it being negative expected return and his risk tolerance is way beyond a million dollars. (For more, read Personalizing Risk Tolerance.)
Real World Application
Better investing seems to lie in the willingness to make good bets, where the expected return is positive, but only wagering in an amount you can certainly afford to lose. In the first example, $10 was definitely an amount most people could afford to lose; however, one million dollars is generally not. Thus, the risk tolerance needs to be coupled with expected return. This way, the investor can be prepared for the perfect storm while still making good investment decisions, just to a lesser degree.

Rule of ThumbA good rule for many might be to wager no more than would affect your earnings power the next year. Simply put, preserve principal, taking risk only to the extent of not making money for the year, but not permanently losing your principal either. If you are near retirement and need your investments to live off of, your risk capacity would be even lighter, suggesting ultra-conservative, non-leveraged investments.
ConclusionUnderstanding horizon leverage and risk tolerance can help the investor avoid financial ruin and the associated feelings when the perfect storm hits. Hired money managers can be useful in building wealth, by understanding what they are investing in and how much leverage they are using. Try to match your risk tolerance to your underlying investment strategy in order to mitigate the likelihood of financial ruin when you are several years down the road and your ability to play the investment game is hindered. Lastly, understand that the perfect storm will eventually happen; just be able to handle it - not by trying to miss the storm through luck, but by having the ability to weather it. (For more on risk tolerance, read Determining Risk And The Risk Pyramid and Risk Tolerance Only Tells Half The Story.)

Warrants: A High-Return Investment Tool

Copy from : http://www.investopedia.com/articles/04/021704.asp#axzz1VrPjuq8B

A warrant is like an option. It gives the holder the right but not the obligation to buy an underlying security at a certain price, quantity and future time. It is unlike an option in that a warrant is issued by a company, whereas an option is an instrument of the stock exchange. The security represented in the warrant (usually share equity) is delivered by the issuing company instead of by an investor holding the shares.

Companies will often include warrants as part of a new-issue offering to entice investors into buying the new security. A warrant can also increase a shareholder's confidence in a stock, provided the underlying value of the security actually does increase over time. (Warrants are just one type of equity derivative. Find out about the others in 5 Equity Derivatives And How They Work.)

Types of Warrants
There are two different types of warrants: a call warrant and a put warrant. A call warrant represents a specific number of shares that can be purchased from the issuer at a specific price, on or before a certain date. A put warrant represents a certain amount of equity that can be sold back to the issuer at a specified price, on or before a stated date.

Characteristics of a Warrant Warrant certificates have stated particulars regarding the investment tool they represent. All warrants have a specified expiry date, the last day the rights of a warrant can be executed. Warrants are classified by their exercise style: an American warrant, for instance, can be exercised anytime before or on the stated expiry date, and a European warrant, on the other hand, can be carried out only on the day of expiration.

The underlying instrument the warrant represents is also stated on warrant certificates. A warrant typically corresponds to a specific number of shares, but it can also represent a commodity, index or a currency.

The exercise or strike price is the amount that must be paid in order to either buy the call warrant or sell the put warrant. The payment of the strike price results in a transfer of the specified amount of the underlying instrument.

The conversion ratio is the number of warrants needed in order to buy (or sell) one investment unit. Therefore, if the conversion ratio to buy stock XYZ is 3:1, this means that the holder needs three warrants in order to purchase one share. Usually, if the conversion ratio is high, the price of the share will be low, and vice versa.

In the case of an index warrant, an index multiplier would be stated instead. This figure would be used to determine the amount payable to the holder upon the exercise date.

Investing in Warrants Warrants are transferable, quoted certificates, and they tend to be more attractive for medium-term to long-term investment schemes. Tending to be high-risk, high-return investment tools that remain largely unexploited in investment strategies, warrants are also an attractive option for speculators and hedgers. Transparency is high and warrants offer a viable option for private investors as well. This is because the cost of a warrant is commonly low, and the initial investment needed to command a large amount of equity is actually quite small.

Advantages
Let us look at an example that illustrates one of the potential benefits of warrants. Say that XYZ shares are currently priced on the market for $1.50 per share. In order to purchase 1,000 shares, an investor would need $1,500. However, if the investor opted to buy a warrant (representing one share) that was going for $0.50 per warrant, he or she would be in possession of 3,000 shares using the same $1,500.

Because the prices of warrants are low, the leverage and gearing they offer is high. This means that there is a potential for larger capital gains and losses. While it is common for both a share price and a warrant price to move in parallel (in absolute terms) the percentage gain (or loss), will be significantly varied because of the initial difference in price. Warrants generally exaggerate share price movements in terms of percentage change.

Let us look at another example to illustrate these points. Say that share XYZ gains $0.30 per share from $1.50, to close at $1.80. The percentage gain would be 20%. However, with a $0.30 gain in the warrant, from $0.50 to $0.80, the percentage gain would be 60%.

In this example, the gearing factor is calculated by dividing the original share price by the original warrant price: $1.50 / $0.50 = 3. The "3" is the gearing factor - essentially the amount of financial leverage the warrant offers. The higher the number, the larger the potential for capital gains (or losses).

Warrants can offer significant gains to an investor during a bull market. They can also offer some protection to an investor during a bear market. This is because as the price of an underlying share begins to drop, the warrant may not realize as much loss because the price, in relation to the actual share, is already low. (Leverage can be a good thing, up to a point. Learn more in The Leverage Cliff: Watch Your Step.)

Disadvantages
Like any other type of investment, warrants also have their drawbacks and risks. As mentioned above, the leverage and gearing warrants offer can be high. But these can also work to the disadvantage of the investor. If we reverse the outcome of the example from above and realize a drop in absolute price by $0.30, the percentage loss for the share price would be 20%, while the loss on the warrant would be 60% - obvious when you consider the factor of three used to leverage, but a different matter when it bites a hole in your portfolio.

Another disadvantage and risk to the warrant investor is that the value of the certificate can drop to zero. If that were to happen before it is exercised, the warrant would lose any redemption value.

Finally, a holder of a warrant does not have any voting, shareholding or dividend rights. The investor can therefore have no say in the functioning of the company, even though he or she is affected by any decisions made.

A Bittersweet Stock Jump
One notable instance in which warrants made a big difference to the company and investors took place in the early 1980s when the Chrysler Corporation received governmentally guaranteed loans totaling approximately $1.2 billion. Chrysler used warrants - 14.4 million of them - to "sweeten" the deal for the government and solidify the loans.

Because these loans would keep the auto giant from bankruptcy, management showed little hesitation issuing what they thought was a purely superficial bonus that would never be cashed in. At the time of issuance Chrysler stock was hovering around $5, so issuing warrants with an exercise price of $13 did not seem like a bad idea. However, the warrants ended up costing Chrysler approximately $311 million, as their stock shot up to nearly $30. For the federal government, this "cherry on top" turned quite profitable, but for Chrysler it was an expensive afterthought.

The Bottom LineWarrants can offer a smart addition to an investor's portfolio, but warrant investors need to be attentive to market movements due to their risky nature. This largely unused investment alternative, however, can offer the small investor the opportunity for diversity without having to compete with the elephants. (What's true for warrants is true for options, learn more in our Options Basics Tutorial.)

Monday 8 August 2011

BURSA in RED

Bursa are in RED now...

I hope everybody are doing well and able to execute the cut loss plan accordingly.

Will keep myself sideway for few days...

Good luck for those who are still in the red sea!

Update on 3.35pm:

All indices turn rebounce... Euro market also up!!!!
Market rebounce? Wonder...
We will see then....

 HSI 20,148.46 -342.11 -1.67%
 Jakarta 3,845.68 -4.58 -0.12%
 Kuala Lumpur 1,485.45 -11.54 -0.77%
 Korea 1,801.35 -68.10 -3.64%
 NIKKEI225 8,944.48 -153.08 -1.68%
 Philippines 4,157.03 -174.21 -4.02%
 Thailand 1,051.80 -26.39 -2.45%
 SSE B 258.74 +0.32 +0.12%
 Singapore 2,884.00 +0.00 +0.00%
 SZSE B 660.31 -11.38 -1.69%
 Taiwan 7,493.12 -59.68 -0.7

FTSE100 5,089.61 +20.66 +0.41%
 DAX 5,981.81 +58.54 +0.99%

Thursday 4 August 2011

Case Study - TSH


1. Trendline: Sideway (Neutral)
2. Bollinger Band: Squeezing, pending breakout (Neutral)
3. ADX: Uptrend with strong momentum (Bullish)
4. MACD: Bullish crossover (Bullish)
5. RSI: Break 50% (Bullish)
6. Stochastic: above 50% (Bullish)
7. Volume Distribution:High selling force (Bearish)


Conclusion: 4 Bull 1 Bear 2 Neutral

Entry Price: 3.26
Profit Taking: 3.36, 3.41
Cut Loss: 3.19

Case Study - BJFOOD


1. Trendline: Sideway (Neutral)
2. Bollinger band: BB start to widening (Bullish)
3. ADX: Uptrend with moderate momentun (Bullish)
4. MACD: Bullish crossver (Bullish)
5. RSI: pending breaking 70% (Neutral)
6. Stochastic: Above 80% (Bullish)
7. Volume Distribution: High buying force (Bullish)


Conclusion: 5 Bull 2 Neutral

Entry Price: 0,97
Profit Taking: 1.01,1.07,1.13
Cut Loss: 0.91

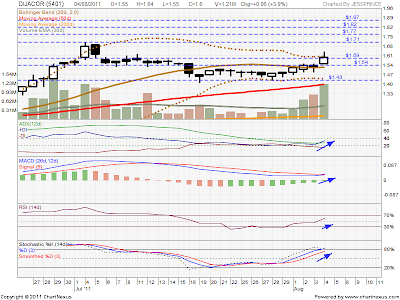
Case Study - DIJACOR


1. Trendline: sideway (Neutral)
2. Bollinger Band: squeesing, pending breakout (neutral)
3. Candle Stick : white body (Bullish)
4. ADX: UPtrend with strong momentum (Bullish)
5. MACD: Bullish kissover (Bullish)
6. RSI: Breakout 50% (Bullish)
7. Stochastic: uptrend and above 80% (Bullish)
8. Volume Distribution: High buying pressure (Bullish)


Conclusion: 6 Bull 2 Neutral

Entry Price: 1.61
Profit taking: 1.69, 1.75,1.80
Cut Loss: 1.53

Case Study- GENM


1. Trendline: sideway (Neutral)
2. Candle Stick: white body (Bullish)
3. Bollinger Band: Start squeeze, pending breakout (Neutral)
4. ADX: uptrend with weak momentum (Bullish)
5. MACD: downtrend (Bearish)
6. RSI: Rebounce and touch 50% (Bullish)
7. Stochastic: Bulllish crossover with signal break 50% and touch 80% (Bullish)
8. Volume Distribution: High buying pressure (Bullish)


Conclusion: 5 Bull 1 Bear 2 Neutral

Entry Price: 3.82
Profit Taking: 3.91, 3.97,4.05
Cut Loss: 3.70

Case Study - RHBCAP


1. Trendline: Sideway (Neutral)
2. Bollinger Band: Upper band start to open (Bullish)
3. ADX: Bullish crosover wtih weak momentum (Bullish)
4. MACD: Forming bottom round (Bullish)
5. RSI: Rebounce from 50% (Bullish)
6. Stochastic: Bullsih crossover with signal line break above 80% (Bullish)
7. Volume Distribution:


Conclusion: 5 Bull 1 Bear 1 Neutral

Entry Price: 9.31
Profit Taking: 9.58, 9.89, 10.13, 10.38
Cut Loss: 8.98

Wednesday 3 August 2011

Case Study - PJI


1. Trendline: downtrend (Bearish)
2. Candle Stick: White candle (Bullish)
3. Bollingerband: strart to breakout with volume greater than 30 EMA (Bullish)
4. ADX: uptrend with weak momentum (Bullish)
5. MACD: forming bottom round (Bullsih)
6. RSI: Rebounce from 50% (Bullish)
7. Stochastic: Break 80% (Bullish)
8. Volume Distribution: High buying pressure (Bullish)


Conclusion: 7 Bull 1 Bear

Entry Price: 0.185
Profit Taking: 0.195, 0.205,0.23
Cut Loss: 0.17

Case Study - KPJ


1. Trendline: Uptredn (Bullish)
2. Candle Stick: hanging man (Bearish)
3. Bollinger Band: Start to widen (Bullish)
4. Form higher high & higher low (Bullish)
5. ADX: uptrend with strong momentum (Bullish)
6. MACD: Bullish crossover (Bullish)
7. RSI : Trending up, pending to break 70% (Bullish)
8. Stochastic: Break 80% (Bullish)
9. Volume Distribution:Strong buying force (Bullish)


Conclusion: 8 Bull 1 Bear

Entry Price: 4.69
Profit Taking: 4.84, 4.96, 5.07
Cut Loss: 4.59

Case Study - CAREPLS


1. Trendline: Uptrend (Bullish)
2. Candle Stick: Bullish Engufy (Bullish)
3. Bollinger Band: Squeezing (Neutral)
4. ADX: uptrend with strong momentum (Bullish)
5. MACD: turning down (Bearish)
6. RSI: Rebounce and break 50% (Bullish)
7. Stochastic: Bullish crossover and break 80% (Bullish)
8. Volume Distribution: Strong buying force (Bullish)


Conclusion: 6 Bull 1 Bear 1 Neutral

Entry Price: 0.515
Profit Taking: 0.54, 0.56
Cut Loss: 0.49

Case Study - CEPAT


1. Trendline: sideway (Neutral)
2. Candle stick : Bullish Engufy (Bullish)
3. BOllinger Band : Start to widen (Bullish)
4. Trading volume : less than 30d EMA (Bearish)
5. ADX: Bullish Kissing (bullish)
6. RSI : Rebounce and touching 50% (Bullish)
7. Stochastic: Break 80% (Bullish)
8. Volume Distribution: High buying force (Bullish)


Conclusoin: 6 Bull 1 Bear 1 Neutral

Entry Price: 1.55
Profit Taking: 1.61, 1.66, 1.69
Cut Loss: 1.48

Case Study - MAS


1. Trendline: Sideway (Neutral)
2. Candle Stick: Bullish engufing (Bullish)
3. Bollinger Band: Breakout with volume greater than 30d EMA (Bullish)
4. ADX: Uptrend with weak momentum (Bullish)
5. MACD: Break 0 (Bullish)
6. RSI: Rebounce and touching 70% (Bullish)
7. Stochastic:  Rebounce and break 80% (Bullish)
8. Volume Distribution: High buying pressure (Bullish)


Conclusion: 8 Bull

Entry Price: 1.65
Profit Taking: 1.72, 1.78, 1.87
Cut Loss: 1.62

Tuesday 2 August 2011

Case Study - Tchong


1. Trendline: Uptrend (Bullish)
2. Bollinger Band : Widening with moderate volume (Bullish)
3. ADX: Uptrend with big momentum (Bullish)
4. MACD: pending bullish crossover (Bearish)
5. RSI: Rebounce from 50% (Bullish)
6. Stochastic: Above 80% (Bullish)
7. Volume Distribution: High buying force close to market end (Bullish)


Conclusion: 6 Bull 1 Bear

Entry Price: 5.00
Profit Taking: 5.20, 5.29,5.40
Cut Loss: 4.88

Case Study - SCOMIEN


1. Trendline: sideway (Neutral)
2. Candle Stick: shooting star (Bearish)
3. Bollinger Band: Breakout with volume greater than 30d EMA (Bullish)
4. ADX: UPtrend with weak momentum (Bullish)
5. MACD: FOrming bottom round and cross 0 (Bullish)
6. RSI: Rebounce from 50% (Bullish)
7. Stochastic: Bullsih crossover with signal line break 50% (Bullish)
8. Volume Distribution: High selling force (Bearish)


Conclusion: 6 Bull 1 Bear 1 Neutral

Entry Price: 0.89
Profit Taking: 0.91, 0.9,1.00
Cut Loss: 0.84

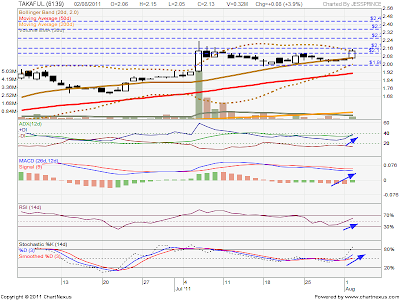
Case Study - Takaful

1. Trendline: Sideway (Neutral)
2. Candle Stick: White body: (BUllish)
3. Bollinger Band: Squeezing, pending breakout (Neutral)
4. Support: Above 20,30, 200d MA (Bullish)
5. ADX: Uptrend with strong momentum (Bullish)
6. MACD: 4R1G (Bullish)
7. RSI: Break 50% (Bullish)
8. Stochastic: Bullish crossover with signal line break 80% (Bullish)
9. Volume Distribution: Strong buying force (Bullish)


Conclusion: 7 Bull 2 Neutral

Entry Price: 2.17
Profit Takiing: 2.25, 2.34,2.42
Cut Loss: 2.09

Case Study - Tasco


1. Trendline : Sideway (Neutral)
2. Candle Stick: Long white body (Bullish)
3. Bollinger Band: Breakout with volume greater than 30d EMA (Bullish)
4. Support: Above 20, 50, 200d MA (Bullish)
5. ADX: Uptrend with moderate momentum (Bullish)
6. MACD: 4R2G with signal line cross 0 (Bullish)
7. RSI: Rebounce and touch 70% (Bullish)
8. Stochastic: Bullish kissover with signal line breaking 80% (Bullish)
9. Volume Distribution: Higher buying pressue (Bullish)


Conclusion: 8 Bull 1 Neutral

Entry Price: 1.66
Profit Taking: 1.70, 1.76,1.80(TP)
Cut Loss: 1.63

Monday 1 August 2011

Case Study - ECM


1. Trendline: Sidway (Neutral)
2. Candle Stick: White long body (Bullish)
3. Bollinger Band: Upper and lower band start to expand (Bullish)
4. Support: Above 20, 50, 200d MA (Bullish)
5. ADX: Uptrend with weak momentum (Bullish)
6. MACD: Bullish Crossover (Bullish)
7. RSI: Rebounce from 50% and touch 70% (Bullish)
8. Stochastic: Break 80% (Bullish)
9. Volume Distribution: High buying pressure (Bullish)


Conclusion: 8 Bull 1 Neutral

Entry Price: 0.94
Profit Taking: 0.98, 0.99
Cut Loss: 0.91

Case Study - LINGUI


1. Trendline: sideway (Neutral)
2. Candle Stick: White Body (Bullish)
3. Form higher low (Bullish)
4. Bollinger band : Band is closing, reduce price volatility , pending breakout (Bearish)
5. ADX: Downtrend with weak momentum (Bearish)
6. MACD: Bullsih crossover (Bullish)
7. RSI: Touching 50% (Bullish)
8. Stochastic: Break 80% (Bullish)
9 Volume Distribution: High buying force (Bullish)


Conclusioin: 5 Bull 3 Bear 1 Neutral

Entry Price: 1.86
Profit Taking: 1.91, 1.96, 2.02 (TP1), 2.08 (TP2)
Cut Loss: 1.80

Case Study - RSAWIT


1. Trendline: Consolidaton & Sidway (Neutral)
2. Bollinger band: squeeze for 2 weeks and start to breakout, both upper and lower band start to widen (Bullish)
3. Candle Stick: White body (Bullish)
4. Support: Above 20, 50, 200d MA (Bullish)
5. ADX: Uptrend with weak momentum (Bullish)
6. MACD: Bullish crossover (Bullish)
7. RSI: Rebounce from 50& (Bullish)
8. Stochastic: K line rebounce from 50% and break above 80% (Bullish)
9. Volume Distribution: Strong buying force (Bullish)


Conclusion: 8 Bull 1 Neutral

Entry Price: 2.52,
Profit Taking: 2. 60, 2.75, 2.84
Cut Loss: 2.47

Remarks: Beware of high selling pressure close to market end.

Case Study - CUSCAPI


1. Trendline: Sideway (Neutral)
2. Candle Stick: Long white body (Bullish)
3. Support: Above 20, 50, 200 MA (Bullish)
4. Bollinger Band: Breakout with volume (Bullish)
5. ADX: Uptrend with moderate momentum (Bullish)
6. MACd: Bullish crossover (Bullish)
7. RSI: Rebounce from 50& (Bullish)
8. Stochastic: Bullish crossover with signal line cross above 80% (Bullish)
9. Volume Distribution: Strong buying force (Bullish)


Conclusion: 8 Bull 1 Neutral

Entry Price: 0.51
Profit Taking: 0.545, 0.57, 0.60,0.63
Cut Loss: 0.48

Case Study - GUANCHG


1. Trendline: Consolidation & sideway (Neutral)
2. Bollinge Band: Breakout after squeeze for 2 weeks with volume greater than 30d EMA (Bullish)
3. MACD : Forming bottom round and pending to cross 0 (Bullish)
4. ADX: Uptrend with weak momentum (Bullish)
5. RSI: Rebounce from 50% (Bullish)
6. Stochastic: Bullish crossover with signal line break 80% (Bullish)
7. Volume Distribution: High buying force (Bullish)


Conclusion: 6 Bull 1 Neutral

Entry Price: 2.81
Profit Taking: 2.87, 2.98, 3.06
Cut Loss: 2.72

Case Study - YTL

Dear Bro Leung,

Below are the analysis on YTL for your reference.

1. Trendline: Downtrend (Bearish)
2. Support : Below 20, 50, 200 MA (Bearish)
3. Bollinger Band : Both upper & lower band down trend, indication for downtrend (Bearish)
4. ADX: Downtrend with strong momentum (Bearish)
5. MACD: Downtrend (Bearish)
6. RSI : Break 30% (Bullish)
7. Stochastic: Bullish crossover with K line cross above 20% (Bullish)
8. Volume Distribution: Higher buying pressue (Bullish), however, selling force high close to market end.


Conclusion: 3 Bull 5 Bear

Remarks: Generally, the counter is at downtrend, migh temperaly pull back to 20d MA based on candle stick, RSI & STo. In order to release herself from downtrend, she need to break the L1 (Pink) line and form higher low /. higher high. Let's continue to monitor this counter.

Case Study - CBIP


1. Trendline: sideway (Neutral)
2. Bollingerband : Breakout after squeeze with volume higher than 30 EMA (Bullish)
3. Candle Stick : Long white bar (Bullish)
4. ADX: Uptrend with weak momentum (Bullish)
5. MACD: Forming bottom round cross 0 (Bullish)
6. RSI : Break up 70% (Bullish)
7. Stochastic: Break 80% (Bullish)
8. Volume Distribution: High selling pressure by big shark to retailer (Bearish)


Conclusion: 6 Bull 1 Bear 1 Neutral

Entry Price: 4.25
Profit Taking: 4.35, 4.46
Cut Loss: 4.21

Remarks: Beware of high selling pressure by Sharks close to market end.