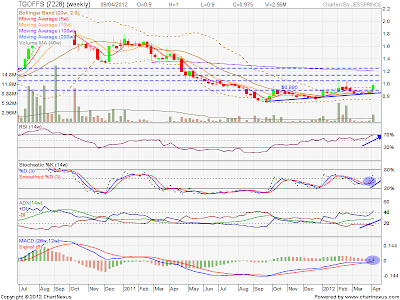
Note: Weekly chart
1. Trendline: Breakout of ascending triangle (bullish)
2. candle stick: white long body (bullish)
3. volume : above 40w ma
4.ADX: uptrend with strong momentum (bullish)
5. MACD: 4R1G (Bullish)
6.RSI: Above 70% (bullish)
7. Sto: bullish crossover (bullish)
8. volume distribution: high buying pressure (bullish)
conclusion: 8 bull 0 bear
position: long
entry: 1.05
profit taking: 1.12, 1.23
cut loss: 1.02
High risk taker:
entry : 0.92
profit taking: 1.02, 1.12, 1.23
cut loss: 0.87


No comments:
Post a Comment